5 March 2013
POST MACRO. EQUITY.
Telecom Services sector (wireline and wireless) : There is still room for growth.
Free cash flow - FCF - is not defined under the U.S. GAAP. Therefore, it should not be considered a substitute for income or cash flow data prepared in accordance with GAAP and furthermore it may not be comparable to similarly titled measures used among different companies. Generally speaking, the FCF is what remains after deducting what is strictly needed for survival from all the cash produced by an industrial company (as opposed to financial or insurance one) in one year. From the point of view of an investor, this FCF is what really matters, as it's the real added value that may be entirely distributed to the stakeholders without compromising a company's existence. Here it can be defined as net cash provided by operating activities less purchases of property, plant and equipment. This is a clear simplification so it should not be inferred that the entire free cash flow amount is available for discretionary expenditures. FCF is a useful measure of performance that may be used as an indication of the strength of a company and its ability to generate cash. By projecting the FCF to the future and discounting it back (employing the so-called weighted average cost of capital, after having performed some other technical steps), it's possible to reach the fair value of stock compared with its market price. However, the big issue is to choose an appropriate FCF future growth rate. This task can be accomplished by looking back into the financial reports of the target company to see how it performed in the past. The fair value of a bundle of peer companies considered as a whole may also be reached to compare the outcome to their market capitalization. With meaningful enough bundles, then an entire economic sector’s over/under or fair-valuation may be inferred.
Based on this methodology, the Telecom service sector (wireline and wireless) on a global scale is, at this stage, relatively undervalued. Let's look at this in more depth.
At the beginning of the year, the global market capitalization of the Telecom Service Sector (wireline and wireless), cleared off ADR (American Depositary Receipts), was around $2.3 trillion. Summed up, total cap. of the first 10 companies was around $1,037bn or 45% of the total. These ten companies look therefore as a good proxy for the entire worldwide telecom service sector.
Here is the list of the companies:
China Mobile Ltd (CHL) / AT&T Inc (T) / Verizon Communications Inc (VZ) / Vodafone Group PLC (VOD) / America Movil SAB de CV (AMX) / Telefonica SA (TEF) / NTT Docomo Inc (DCM) / Telstra Corp Ltd (TTRAF.PK) / Nippon Telegraph and Telephone Corp (NTT) / Deutsche Telekom AG (DTEGF.PK).
It’s important to note that Nippon Telegraph and Telephone Corp group has 66.66% ownership of the NTT Docomo Inc as of June 29, 2012 (form 20-F, pg.17, 2012-06-29).
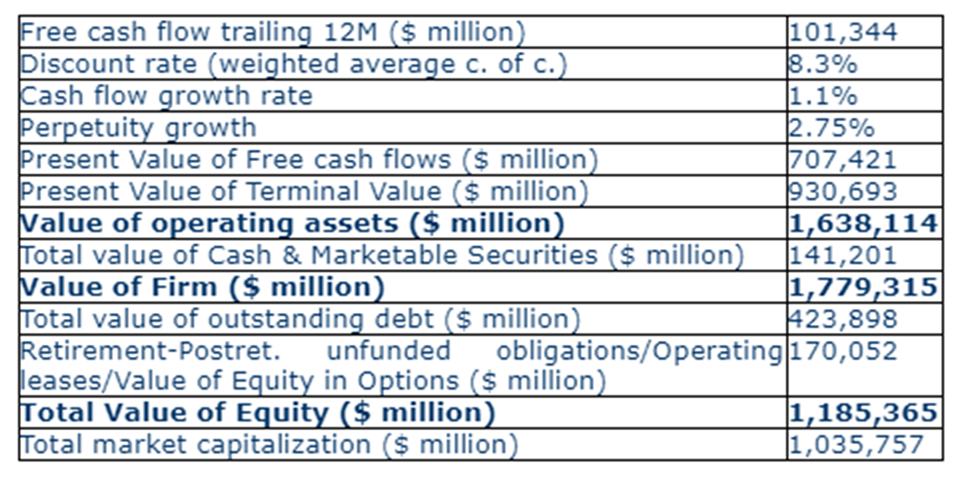
The total operating cash flow of these companies for the last 12 months stands at $217.13bn* and capital expenditures totaling $115.79bn**, so the total FCF is $101.34bn with the weighted average cost of capital computed at 8.3% (this is a weighted average by market capitalization of each single company’s w.a.c.c.). Using data (if and where available) from the most recent available annual reports, the estimated impact of operating leases, outstanding stock options, retirement and postretirement unfunded obligations, is a combined $170.05bn.
A reasonable FCF growth rate for the short/medium term (up to 10 years) could be estimated at 1.1% (this is a weighted average by market cap. of each estimated single company’s FCF growth rate for the short/medium term).
While in the long term (over ten years), this rate is estimated at a stable 2.75% which is equal to growth rate projections for the overall world economy.
Given all the above-mentioned assumptions, the final calculation gives a total value of equity for the bundle of companies equal to $1,185.36bn, which is about 14.4% higher than their total market capitalization of $1,035.76bn as of 4 March 2013.
If the cash flow growth rate for the short/medium term (up to 10 years) is placed at no-growth level (around 0%), then the final calculation gives an overall total value of equity equal to the current total market capitalization of the bundle of companies. This is the implied growth rate given by market participants to this bundle of Telco companies considered as a whole and sounds too pessimistic.
We can conclude that the global telecom service sector, considering the bundle of companies as its proxy, seems to be relatively undervalued.
* The ttm operating cash flow of Telefonica SA has been estimated taking into account the announcement to the market (form 6-K) dated 15 February 2013. The ttm operating cash flow of Verizon Communications Inc and AT&T Inc have been reduced by operating cash flow attributable to noncontrolling interests (distributions to NCI).
** The capex of Telefonica SA includes intangibles. The capex of Vodafone Group PLc, America Movil SAB de CV and NTT Docomo Inc have been estimated.
Only DIAWONDS® is allowed to copy and redistribute by email or post to the web this report. All rights reserved - Copyright DIAWONDS® 2013.